

Cryo-EM
The Cryo-EM plugin allows you to load Cryo-EM maps into Nanome.
There are 2 ways to load a map into Nanome:
Load a map from the Electron Microscopy Data Bank (EMDB), and align it with its corresponding model from the RCSB PDB.
Load maps and models from your Vault.
Instructions
Load Map and Model
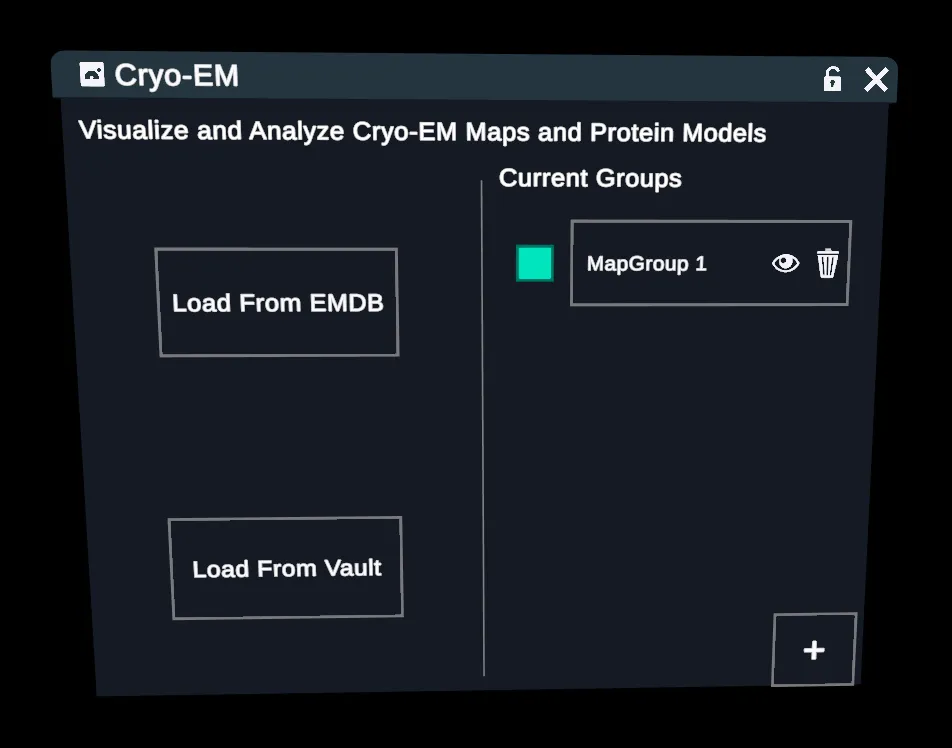
Ensure that a map group is selected on the right-hand side of the main menu
- Map groups are used to organize your maps and models. You can have 1 map per map group, with multiple models.
- The map group with a green square next to it is the one that the maps/models will be added to in the following steps
Select which method you wish to load the map with
- Loads a map from the Electron Microscopy Data Bank.
- Loads maps and models from your Vault.
- Marks the map group that maps and models are added to.
- A map group. Click it to open the Edit Map Menu.
Load from Vault
- Load From Vault opens the Vault navigation menu.
- Find the maps and models you have already uploaded, select them, and press Load.
Load from EMDB
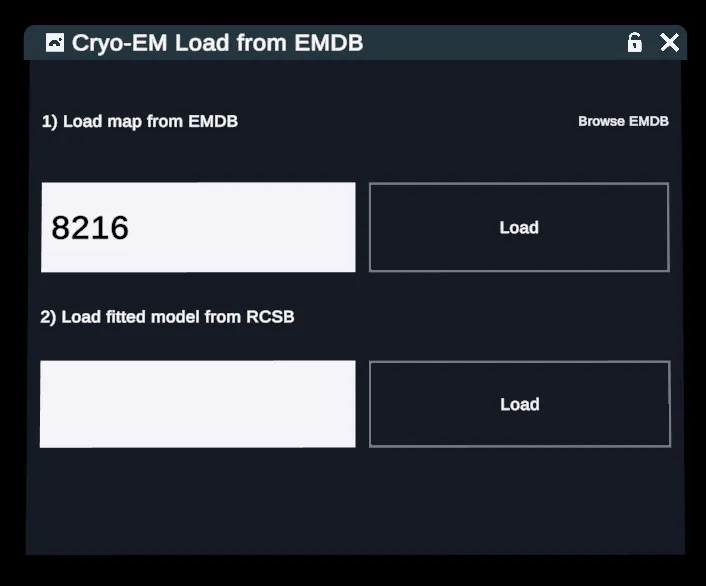
Find the EMDB ID for the map you want to load. Enter the ID in the Textbox and press Load.
- The Browse EMDB button will open EMDB in the web browser
- The plugin checks a map's size before downloading it, and shows an error if the map is over its size limit.
- After the map loads, the RCSB code appears in the next Textbox. Press Load to load it.
- The structure will be added to your workspace, and aligned to the previously loaded map.
- Opens EMDB in the web browser.
- The Textbox for the map's EMDB ID.
- Loads the map, if it's under the plugin's size limit.
- Filled in with the RCSB code after the map loads.
- Adds the structure to your workspace, aligned to the map.
Edit Map
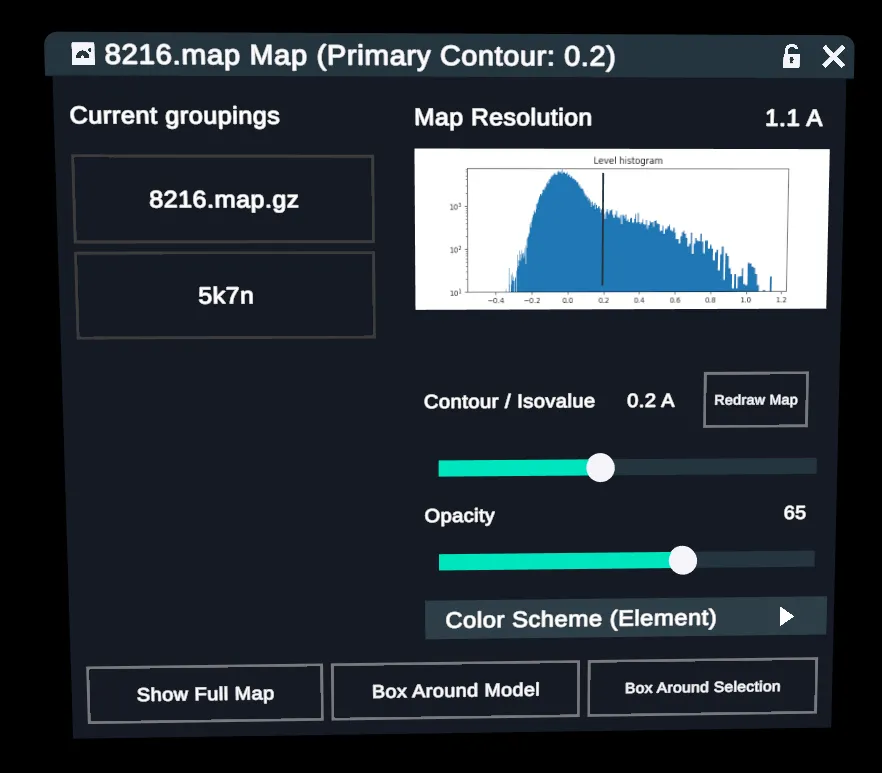
To edit map colors and isovalues, click the map group on the right-hand side. This will open the Edit Map Menu.
- The slider for a new isovalue.
- Redraws the map at the isovalue on the slider.
- Sets how opaque the map is, in percent. The map updates when you let go of the slider.
- Dropdown for the coloring scheme of the map.
- Renders the entire map.
- Renders the map only around the model.
- Renders the map around selected atoms.
Edit Isovalue
Select a new isovalue on the slider, and press the "Redraw Map" button
Change Color Scheme
On the bottom of the menu, there is a dropdown to edit the coloring scheme of the map.
Note that color schemes are based on loaded model, so just a map on its own will not be colored.
Color Options:
- Element: When a model is present, the map is colored according to the nearest element on the model
- Bfactor: Colored by the model's B-factors.
- Chain: Each chain on the model is given a different color.
Map Boxing Options
We provide the ability to only show a subset of the loaded map.
There are 3 ways to edit the section of the map rendered.
- Show Full Map: This will render the entire map. This is the default load mode, so it's useful for resetting after using other boxing methods.
- Box Around Model: When a model has been added to the map group, this will only render the map around the model.
- Box Around Selection: The map will be rendered around selected atoms on the model. This is useful around larger models, when you only want to see a small subset.